Previous Context
In the previous study on Xiaohongshu note title clustering, we initially classified the results using BERT output, reduced the dimensions of the classification results using T-SNE, and finally identified three types of notes: “Makeup Tutorial,” “Second-hand Trade,” and “Commercial Promotion.” Obviously, the final step heavily relies on human judgment, making it difficult to scale and less objective.
Density-Based Clustering Algorithm
This time, we have added clustering based on DBSCAN on top of what we did previously (DBSCAN is a density-based clustering algorithm that adjusts clustering results based on “minimum distance within the same class” (eps) and “minimum number of samples” (min_samples)). Compared to traditional KMeans clustering (which adjusts clustering results by specifying the number of clusters), this algorithm has several advantages:
- No need to specify the number of clusters (clearly, we cannot know the total number of clusters in Xiaohongshu titles).
- Points with no clear cluster relationships will be assigned to other classes.
However, applying this algorithm also comes with a challenge: how to find suitable values for the eps and min_samples parameters.
Parameter Tuning
Using Silhouette Score as an Evaluation Metric
Clearly, if eps or min_samples are set too large, it will result in a large number of points being grouped into the same class, leading to the loss of useful information, and vice versa. To address this issue, we first introduced the “Silhouette Score” as an evaluation metric for the algorithm, testing the “Silhouette Score” for different parameters. Ideally, a larger “Silhouette Score” is better (indicating clearer classification boundaries). However, in the task mentioned above, a large Silhouette Score can have two negative effects:
- Reduced total number of clusters.
- Increased number of samples in the “other” class.
Introducing “Percentage of Other Class Samples” and “Total Number of Clusters” to Optimize the Evaluation Metric
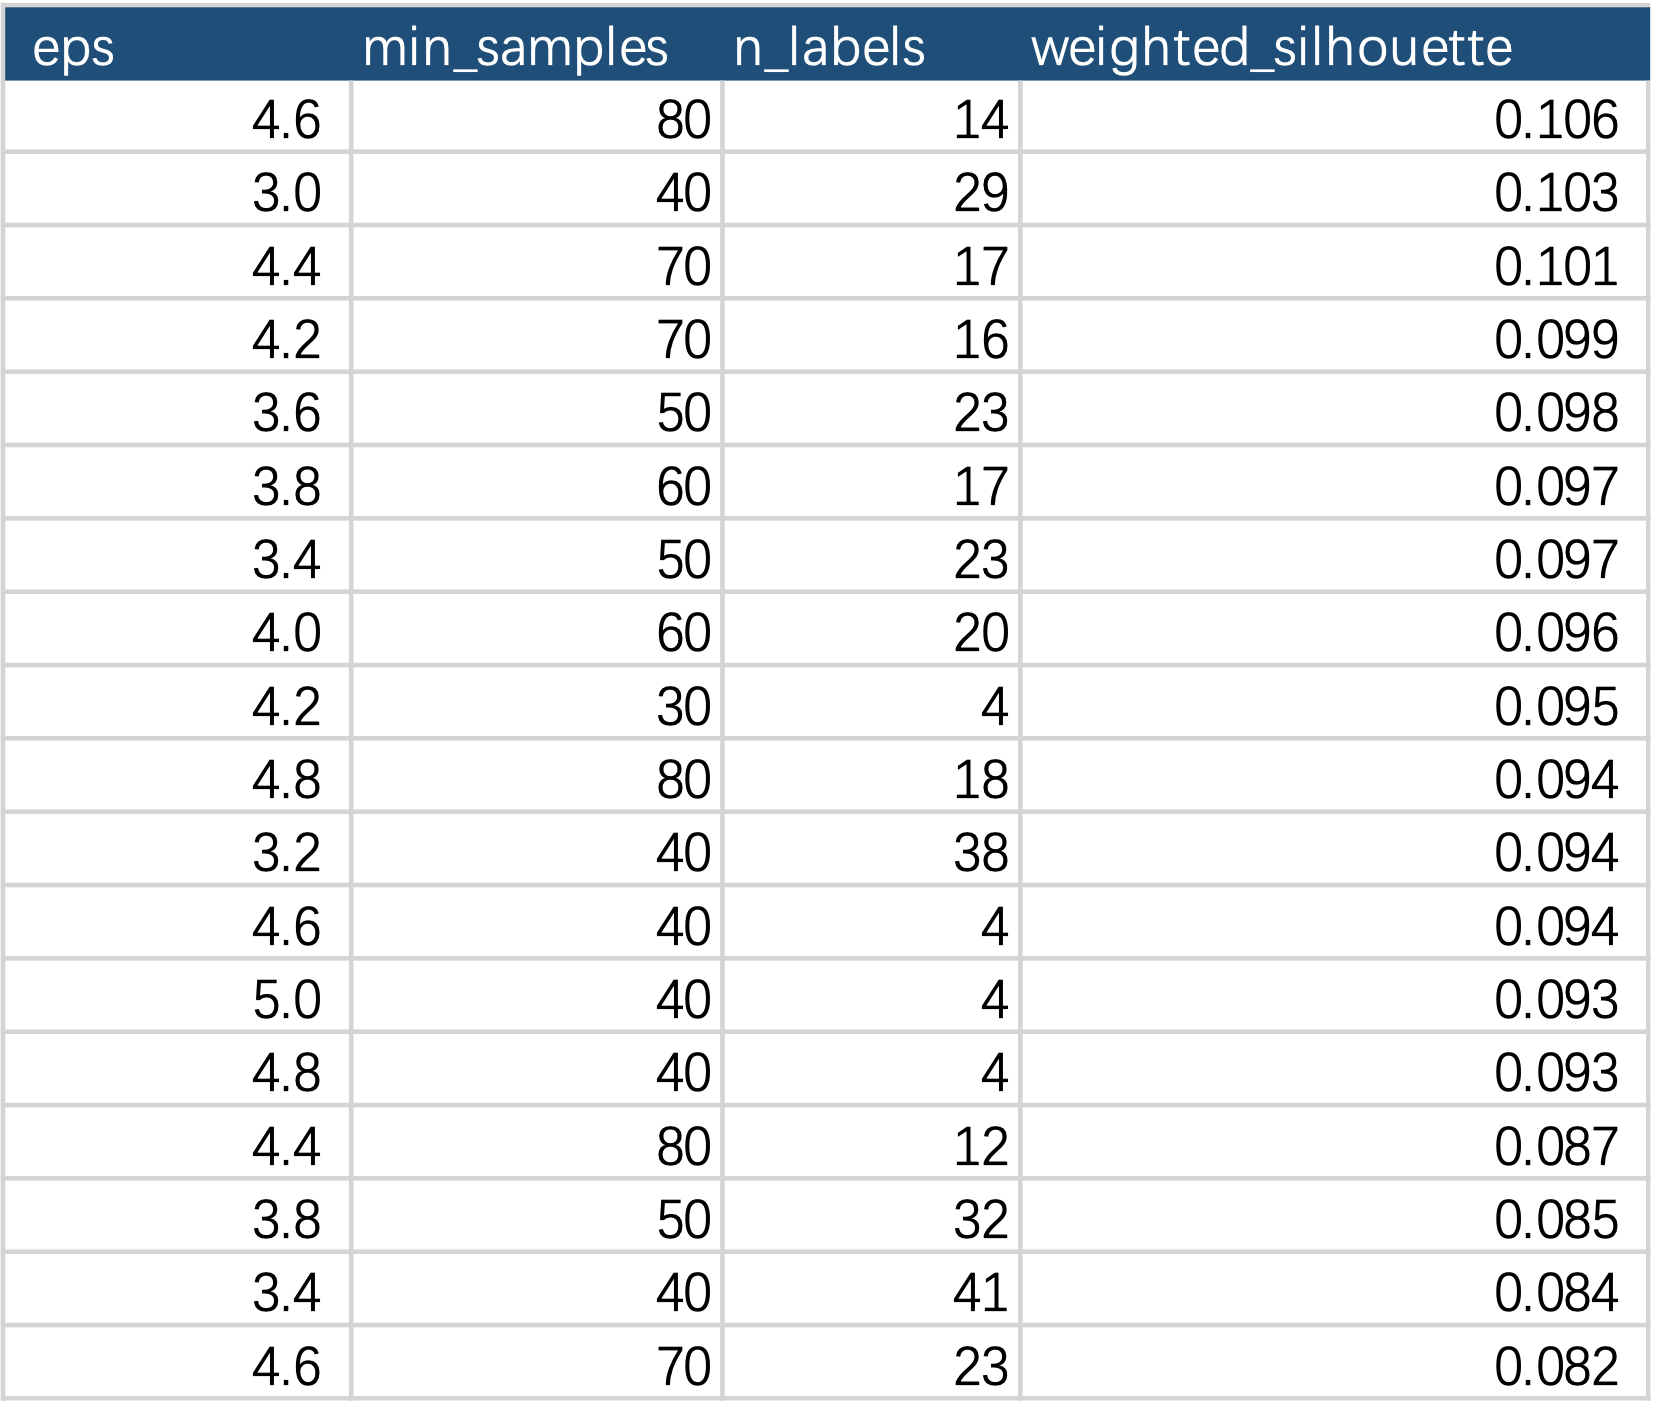
To overcome the above negative effects, we introduced the “Percentage of Other Class Samples” and used the harmonic mean of this metric with the Silhouette Score as the clustering score (the higher, the better). At the same time, we calculated the total number of clusters for different parameters. The table below shows the clustering scores (weighted_silhouette) for some parameter settings.

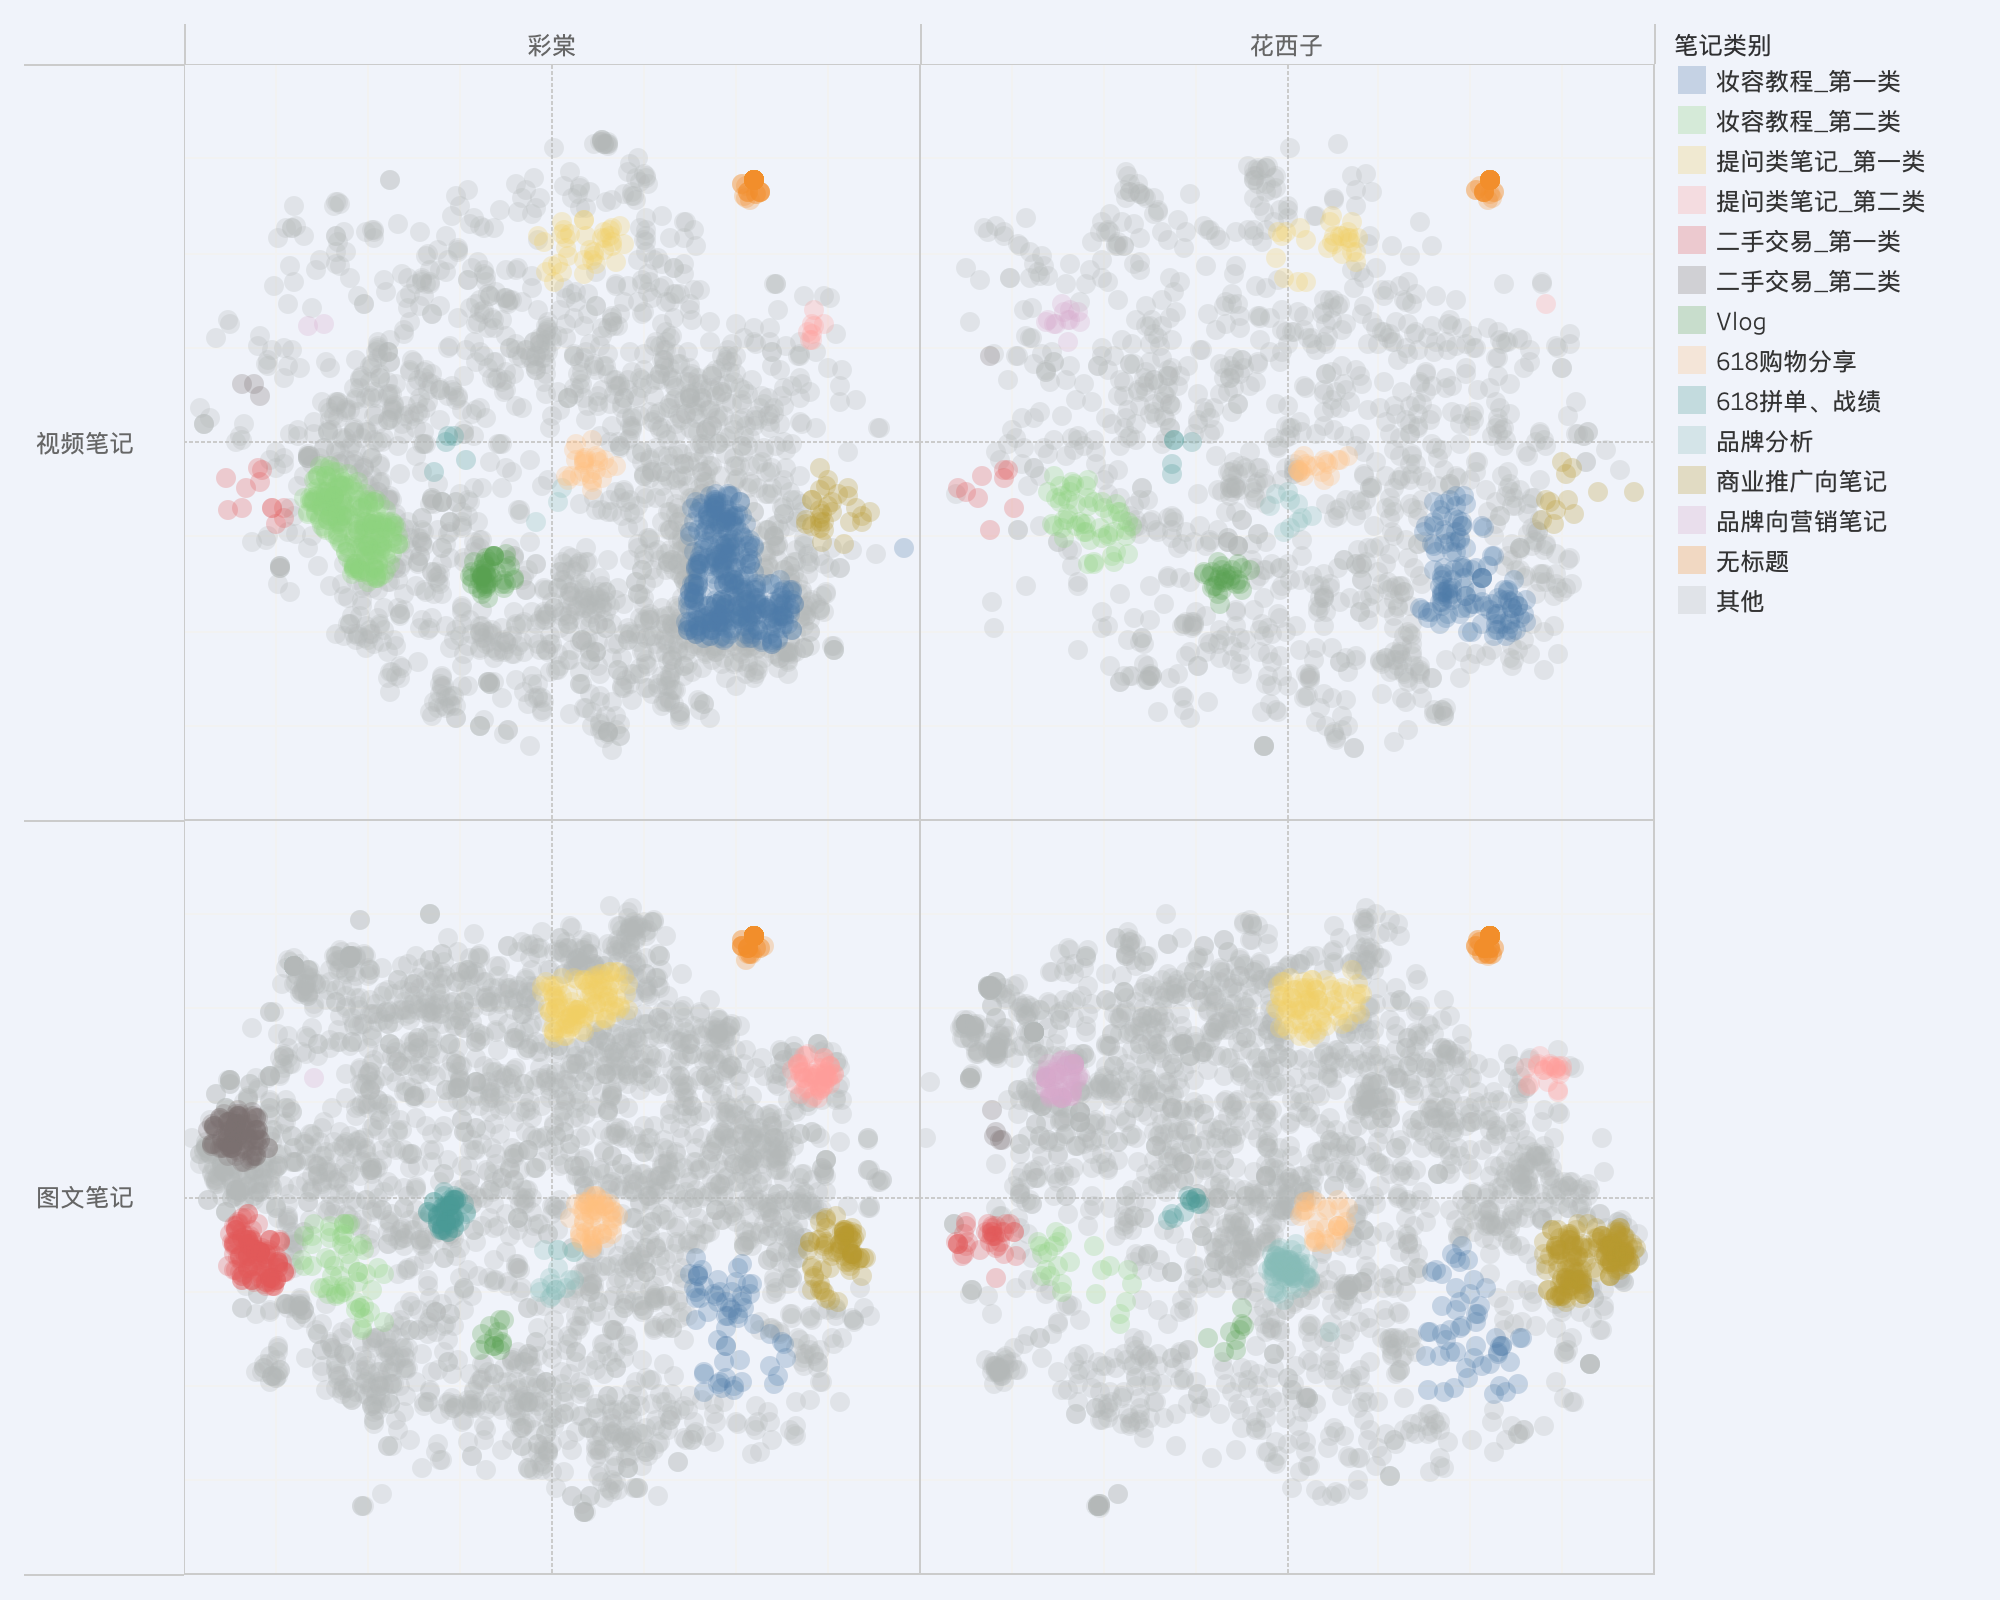
The final solution we selected was the one with the highest weighted_silhouette score among cases where n_labels is greater than 10. The final clustering result is as shown in the following figure. We not only clearly distinguished the three types of notes (“Makeup Tutorial,” “Second-hand Trade,” and “Commercial Promotion”) identified by the previous solution but also identified an additional 7 classes of notes.

Appendix
Silhouette Score
The Silhouette Score is a metric used to evaluate the quality of clustering. It aims to measure both the compactness and separation of samples in clustering results. It helps us understand how well a clustering algorithm has divided samples into similar clusters with distinct boundaries.
Specifically, for each sample, the Silhouette Score considers two factors:
-
The similarity of a sample to other samples in the same cluster: It measures the average distance between the sample and other samples within its cluster. A smaller value indicates that the sample is tightly packed with other samples in its cluster, indicating better clustering.
-
The similarity of a sample to samples in the nearest different cluster: It measures the average distance between the sample and samples in the nearest cluster other than its own. A larger value indicates that the sample is further from samples in other clusters, also indicating better clustering.
Considering both of these factors, the Silhouette Score’s value ranges from -1 to 1:
- A higher positive value indicates that the sample is closer to other samples in its cluster and farther from samples in other clusters, indicating better clustering.
- A value close to zero indicates that the distance of the sample to samples in its own cluster is similar to the distance to samples in other clusters, indicating unclear clustering.
- A negative value indicates that the sample is closer to samples in other clusters, indicating poor clustering.
Therefore, a Silhouette Score closer to 1 indicates better clustering, while a score closer to -1 or less than 0 indicates worse clustering. When using the Silhouette Score, we aim to find the highest score to achieve the best clustering results.
